
How to Use Claude / Copilot
as a Mini CEO?
Run Claude — or Microsoft Copilot — as a strategic thought partner that works alongside you like a mini CEO: pressure-testing your decisions, drafting the plan, and turning scattered thinking into clear weekly priorities and actions.
Led by practitioners,
not theorists

Chan Wei Khjan
Audit Partner, YYC · MIA Board
Chartered Accountant (ACCA · C.A.(M) · FCA Singapore) and MIA board member. Featured in Business Insider for pioneering AI inside the accounting profession.

Marcus Chia
AI Product Manager & Harness Engineering Expert
Builds and ships AI workflows in the wild — Claude projects, MCP servers, multi-agent pipelines and data dashboards. Turns messy business problems into working AI solutions.

Warren Leow
Founder, AITraining2U PLT
Drives AITraining2U's mission to equip 100,000 Malaysians with practical AI skills — hands-on with AI agents, automation and applied analytics for enterprise teams.
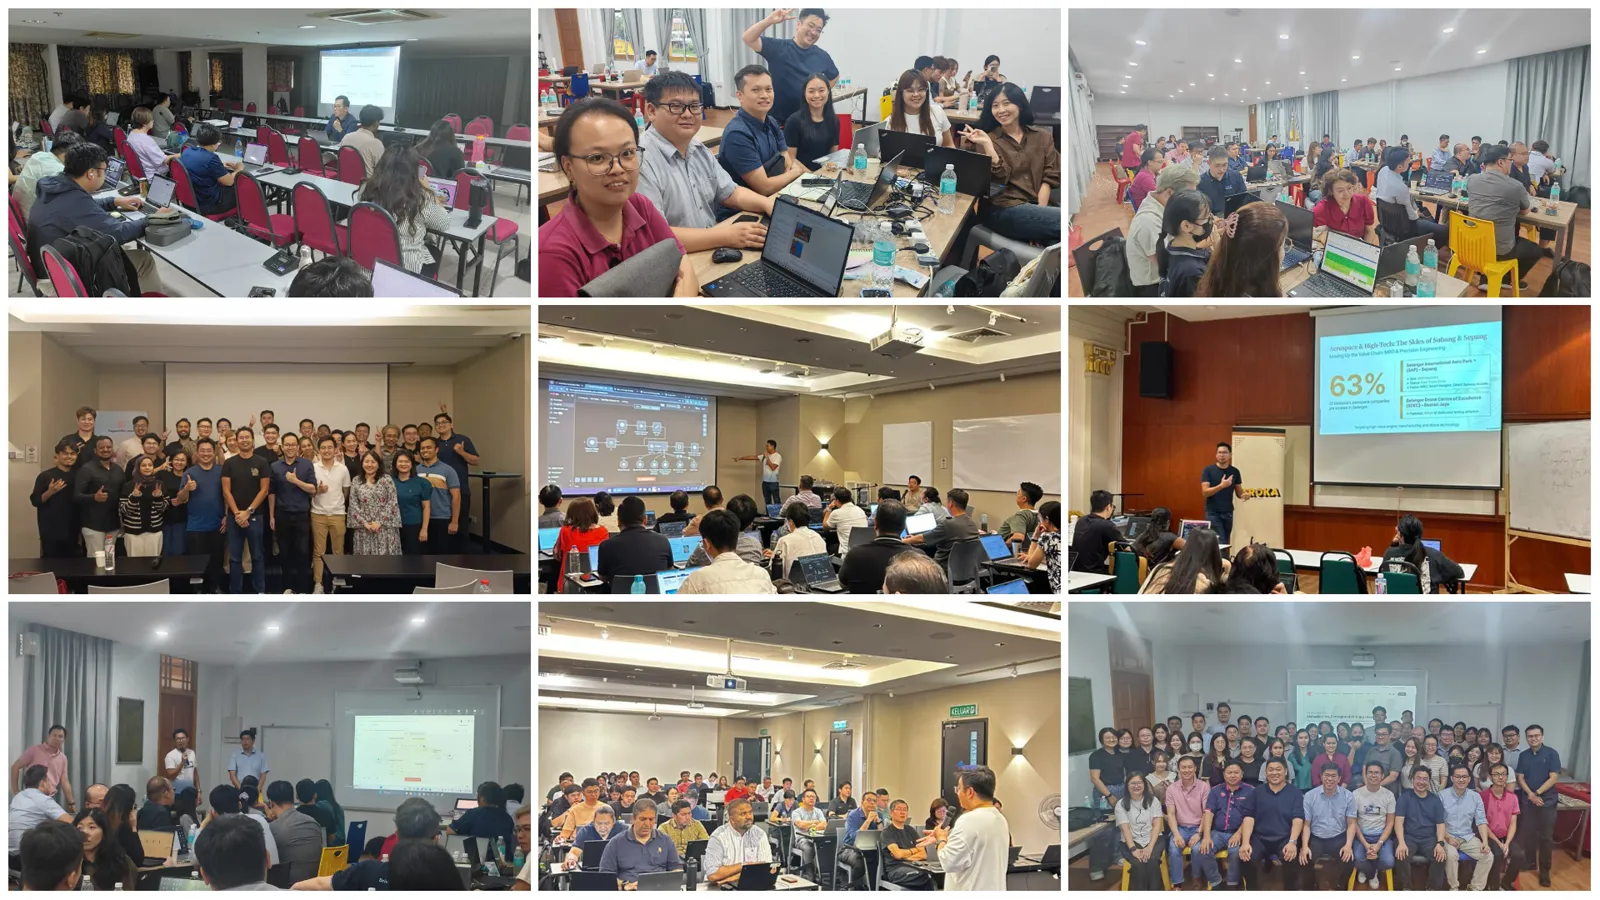
Today you'll build alongside us — every Mini CEO example paired with something you can try the moment you're back at your desk.
Trusted by leading Malaysian organisations























Banking, telco, retail, healthcare, energy & government-linked companies — teams across Malaysia upskill with AITraining2U.
Most founders aren't short
on ideas.
They're short on time to see clearly — the market moves, the numbers pile up, and every day brings a dozen calls only they can make.
A real CEO has a chief of staff, an analyst and a strategist feeding them. Run Claude as all three, and the work that used to take a team takes a prompt.
Five ways to run Claude
as your Mini CEO
Every example ships with a set of copy-ready prompts — tap Copy, paste into Claude, edit the bracketed bits, run.
Know the field cold — without 40 open tabs
Market research prompt set
Using the live web, map the [industry] market in [country / region]. Find the top 6-8 players. For EACH, visit their site and capture: - Positioning & target ICP - Core offer + top 3 features - Pricing tiers (price + what's in) - Proof: logos, case studies, funding - Their sharpest & weakest message Output one comparison table, a row per player. Cite a source URL for every fact and flag anything you couldn't verify. Then rate the market's attractiveness with Porter's Five Forces — rivalry, new entrants, substitutes, buyer & supplier power — High / Med / Low each, one line of why.
Here's what we do: [1-paragraph description + our pricing]. Using the landscape above: 1. Plot us vs rivals on a 2×2 positioning map: [axis 1] vs [axis 2]. 2. Find 3 "white space" gaps nobody owns — segment, price, or message. 3. Score each gap on a 2×2: market attractiveness × our right-to-win (with a rough TAM for each). 4. Flag the 3 biggest shifts in this market in the last 6 months. Recommend the ONE angle to test next quarter, and the first step.
Now automate this. Using Cowork, Schedule it to run every Monday at 8am: 1. Re-check [Rival A / B / C] — their site, pricing and any new launches. 2. Compare to last week and flag what changed. 3. Scan the web for news mentioning them. Then email me a one-page digest via Gmail with a "what to act on first" section. Draft it — don't send.
Tip: same play in either stack — Claude + Cowork + Gmail, or Copilot + Microsoft 365 + Outlook.
What comes back: the landscape, filled in
Our running example — “Kopi Kita”, a fictional 14-outlet KL specialty-coffee chain — runs the landscape prompt. Claude reads the live web and hands back a sourced table plus a structured read:
| Player | Positioning | Avg cup | Sharpest edge |
|---|---|---|---|
| ZUS | Affordable, tech-led | RM9–12 | App + scale |
| Tealive | Mass-market tea | RM7–10 | Outlet density |
| Indie specialty | Premium, bean-story | RM15–20 | Craft + loyalty |
| Kopi Kita | Local specialty, mid | RM11–14 | — (to define) |
Nobody owns “specialty-grade coffee at mass-market speed” for the office-lunch crowd. Kopi Kita can take the RM12 weekday-subscription niche.
- • Rivalry: High — ZUS & Tealive expanding fast
- • New entrants: High — low capital barrier
- • Buyer power: Med — near-zero switching cost
- • Supplier power: Rising — bean prices +19% YoY
Illustrative figures for teaching — not real company data. A live run cites every source URL.
See around corners before you commit
Scenario planning prompt set
We're weighing [decision / initiative]. Our position now: [revenue, costs, cash, headcount, key numbers]. Model 3 scenarios over the next [timeframe] — best / base / worst. For EACH: - The 3-4 key assumptions - Impact on revenue, cost and cash - The single trigger that tips us in - A rough probability Show it as a side-by-side table, add a probability-weighted "expected case" row, then tell me which scenario our current plan is secretly betting on.
Now stress-test the base case. 1. What single event would break it? Walk the chain of consequences step by step, and how much runway we'd have to react. 2. For all 3 scenarios, give the earliest leading indicators — 4-5 metrics to watch, each with the threshold that should trigger action. 3. Sensitivity check: which 2 variables move the outcome most? Rank them and show the swing. Keep it specific to us, not a generic risk register.
For the worst case, use Cowork to build a 1-page contingency plan: what to cut, what to protect at all costs, and the first 3 moves in week one. Then turn the early-warning metrics into a monitoring checklist, and add a recurring "scenario review" to my Google Calendar on the first Monday of each month — with that checklist in the invite notes.
Tip: attach your actuals and the model runs on real numbers — in Claude (Cowork + Google Calendar) or Copilot (Outlook Calendar).
Three scenarios, costed
Kopi Kita weighs opening 6 new outlets in FY26. Claude models it on the current numbers:
| Scenario | Key assumption | Revenue | EBITDA | Runway | Prob. |
|---|---|---|---|---|---|
| Best | 8 outlets, SSS +8% | RM18.0m | RM2.7m (15%) | 14 mo | 25% |
| Base | 6 outlets, SSS +4% | RM15.2m | RM1.8m (12%) | 11 mo | 50% |
| Worst | 3 open late, SSS −3% | RM11.5m | RM0.4m (3%) | 5 mo | 25% |
Probability-weighted EBITDA ≈ RM1.7m. The plan quietly bets on Base — but only Worst drops runway below 6 months.
Same-store sales moves the outcome most: a 3-pt SSS swing flips FY26 between comfortable and cash-tight. Watch it weekly — it's the early-warning trigger.
Illustrative figures for teaching — Claude runs this on your real actuals when you attach them.
A chief of staff, every morning
Daily brief prompt set
Act as my chief of staff. Connect to my Google Calendar and Gmail. Each morning, give me a brief under 250 words: 1. TODAY — my 3 top priorities, ranked by the Eisenhower matrix (urgent × important). Flag the one 80/20 task that moves the most. 2. MEETINGS — for each, a one-line "why it matters" and the question to walk in with. 3. WAITING ON ME — decisions people are blocked on, each with a default. 4. AT RISK — anything likely to slip. Confirm the format, then run today's.
Go through my Gmail from the last 24 hours and triage it into: - Needs a decision from me (add a 1-line recommendation each) - Needs a quick reply (draft it) - FYI only (one-line summary) - Ignore / unsubscribe Don't send anything — save the replies as Gmail drafts so I can review, tweak and send.
Schedule this to run on its own. Every weekday at 7:30am, using Cowork: 1. Read my Google Calendar and Gmail. 2. Generate the morning brief above. 3. Email it to me first thing. Also block 30 min of "focus time" on my calendar each afternoon in my lightest stretch, and protect it from new invites.
Tip: connect Gmail + Google Calendar to Claude, or Outlook to Copilot — either sees your real day and delivers the brief.
Monday's brief, in your inbox
7:30am, before Kopi Kita's founder sits down — priorities ranked by the Eisenhower matrix, the 80/20 task flagged first:
- Sign the Bangsar lease before 5pm — landlord has another offer 80/20
- Approve Q3 bean-supplier switch — locks price 6 mo
- Reply to Grab partnership email
10:00 Ops review — SSS dipped 2 weeks; walk in asking “which 3 outlets, and why?”
14:00 Investor call — they'll probe runway; lead with cash-months.
2 approvals: marketing RM40k (default: approve), new-hire offer (default: hold). At risk: TTDI opening slipping 3 wks — permit stuck.
Each item is scored urgent × important. The lease is both — so it leads. Busywork gets delegated or dropped, not surfaced.
You open your laptop to three decisions, not fifty open loops — each with a recommended default, so most of the list is just “yes”.
Illustrative — generated from a fictional calendar & inbox. Your run reads your real Google Calendar & Gmail.
Read the story behind the numbers
Metrics & financial review prompt set
Here's our P&L / metrics for [period] (attached as a spreadsheet, or below). 1. Summarize the story in 5 bullets — what's up, what's down, and the one headline I'd give the board. Plain English, no jargon. 2. Compare to [last period / budget]: flag every variance over [10]%, name the likely driver, and output a table sorted by impact on the bottom line. 3. Compute the core metrics — gross & contribution margin, EBITDA margin, cash runway (months) — and build a variance bridge from budgeted to actual EBITDA, RM impact per driver.
Now pressure-test the numbers. 1. What doesn't add up, or would worry a sharp investor? Point me at early warnings — margin drift, cash burn, a cost line outgrowing revenue, customer concentration. Flag any metric breaching a healthy threshold (gross margin, cash runway, CAC payback). 2. What are the 3 numbers I should manage most closely this month? 3. For each, give one concrete action to move it and the metric I'll check. Be direct — what would you fix first?
Automate this for month-end. On the last working day of each month, using Cowork (Schedule it): 1. Pull the latest P&L [from the sheet / connected source]. 2. Run the variance + red-flag checks. 3. Draft a 1-page review with the 3 actions. Email it to me via Gmail and add a 20-min "finance review" to my Google Calendar the next morning.
Tip: it reads the cells straight from the sheet — Claude or Copilot in Excel — then Cowork / Copilot make the monthly close a routine.
March P&L, read in 30 seconds
Kopi Kita pastes its March P&L vs budget. Claude returns a variance bridge and the numbers to manage:
| Line | Actual | vs Budget | Driver |
|---|---|---|---|
| Revenue | RM1.32m | +6% | 2 new outlets ramping |
| COGS | RM0.54m | +19% | Bean price rise, not passed on |
| Gross profit | RM0.78m · 59% | −4 pts | COGS outpacing price |
| Opex | RM0.68m | +2% | In line |
| EBITDA | RM0.10m · 8% | −38% | Margin squeeze |
COGS up 19% while price held flat — a RM1/cup rise restores gross margin to ~63% and adds ~RM0.13m EBITDA.
- • Gross margin 59% → target 63%
- • Same-store sales +4% → hold above +3%
- • Cash runway 7 mo → rebuild past 12
Illustrative figures for teaching — Claude reads the real cells straight from your attached spreadsheet.
From a spreadsheet to a dashboard you can share
Live dashboard prompt set
Here's our data: [attach the spreadsheet — e.g. monthly actuals by outlet]. Build me an interactive dashboard as an Artifact. Include: - A KPI strip: revenue, gross margin %, cash runway, same-store sales - A bar chart of revenue by outlet - A line chart of revenue & margin over time - A filter to switch outlet / month Clean, modern, brand accent #D97757 on a cream background. Make it shareable.
Now refine it. Iterate with me: 1. Add a view ranking outlets by contribution margin, worst first. 2. Colour margin below 60% red, above 65% green. 3. Add a scenario toggle — low / base / high — that flexes revenue by an assumption I set. 4. Add a one-line "so what" insight box up top that updates with the filter. Rebuild the Artifact each time so I see the change live.
Keep this dashboard live. Using Cowork, Schedule it to run every month-end: 1. Pull the latest numbers [from the sheet / connected source]. 2. Rebuild the dashboard Artifact with the new month added. 3. Write a 3-bullet "what changed vs last month" summary. Email me the updated dashboard link and the summary via Gmail.
Tip: Claude Artifacts make it a working app; in Copilot the same lives in Excel / Power BI — refreshed and shared automatically.
One dashboard, the whole business at a glance
Kopi Kita turns its outlet data into a live dashboard — the founder and every outlet manager open the same link:
One link, always current. Cowork rebuilds it every month-end and emails the team — no BI licence, no analyst, no stale slides.
- • KPI cockpit — revenue, margin, runway, SSS
- • Revenue & margin by outlet, filterable
- • Low / base / high scenario toggle
- • "So what" insight that updates with filters
Illustrative figures for teaching — the real Artifact is built live from your attached spreadsheet.
The Mini CEO operating system
Claude isn't an oracle.
It's a thought partner.
The founders who get the most out of AI aren't the ones who ask it for answers — they're the ones who ask it to argue, structure, and execute.
A modern CEO's five-sided skill set
The Mini-CEO playbook you just ran is orchestration in action. The leaders who compound that edge build capability across all five points of the AI pentagon — and let orchestration conduct the lot.
Each point is a hands-on, HRDC-claimable AITraining2U course — the pentagon from our Manifesto, made practical. Next: where to learn each →
Our courses at AITraining2U.com
All courses are HRDC-claimable — available as enterprise & public workshops. AITraining2U.com

Thank you.
Pick one example from today, run it on a real decision this week, and let us know how it goes.
Practical. Proven. Purposeful. — AITraining2U PLT